Passenger traffic in billion passenger kilometers
This one dedicated to Arthur Figgis.
| D | long distance | local or regional | of that: DB | Others | SNCF | TGV | Paris local traffic | rest | Switzerland | GB | China | |
|---|---|---|---|---|---|---|---|---|---|---|---|---|
| 1991 | 57.0¹ | 33.7¹ | 23.3¹ | 62.4 | 17.9 | 10.0 | 34.5 | 32.5² | ||||
| 1992 | 57.2¹ | 32.6¹ | 24.6¹ | 63.0 | 19.0 | 10.1 | 33.9 | 31.7² | ||||
| 1993 | 63.4¹ | 33.5¹ | 29.9¹ | 58.4 | 18.9 | 9.9 | 29.6 | 30.4² | ||||
| 1994 | 65.2¹ | 34.8¹ | 30.3¹ | 58.9 | 20.5 | 9.5 | 28.9 | 28.7² | ||||
| 1995 | 71.0 | 36.3 | 34.7 | 55.6 | 21.4 | 8.5 | 25.7 | 11.7 | 30.0² | |||
| 1996 | 71.7 | 35.6 | 36.1 | 59.8 | 24.8 | 8.9 | 26.1 | 11.9 | 32.1² | |||
| 1997 | 72.4 | 35.2 | 37.2 | 61.8 | 27.6 | 9.2 | 25.0 | 12.1 | 34.7² | |||
| 1998 | 72.7 | 34.6 | 38.1 | 64.5 | 30.0 | 9.3 | 25.2 | 12.1 | 36.3² | |||
| 1999 | 73.8 | 34.9 | 38.9 | 66.2 | 32.4 | 9.1 | 24.7 | 12.5 | 38.5 | |||
| 2000 | 75.4 | 36.2 | 39.2 | 38.2 | 1.0 | 69.9 | 34.7 | 9.7 | 25.5 | 12.6 | 38.2 | |
| 2001 | 75.8 | 35.3 | 40.4 | 39.1 | 1.3 | 71.5 | 37.4 | 9.9 | 24.2 | 13.3 | 39.1 | |
| 2002 | 70.8 | 32.7 | 38.2 | 36.7 | 1.5 | 73.5 | 39.8 | 10.1 | 23.6 | 14.1 | 39.7 | 479.2 |
| 2003 | 71.2 | 31.6 | 39.6 | 37.9 | 1.7 | 71.7 | 39.6 | 9.5 | 22.6 | 14.5 | 40.9 | 458.5 |
| 2004 | 72.5 | 32.4 | 40.1 | 37.9 | 2.2 | 74.3 | 41.4 | 9.9 | 23.0 | 14.9 | 41.8 | 549.9 |
| 2005 | 74.9 | 33.7 | 41.2 | 38.9 | 2.3 | 76.5 | 42.7 | 10.2 | 23.6 | 16.1 | 43.2 | 603.5 |
| 2006 | 78.7 | 34.5 | 44.2 | 40.3 | 3.9 | 78.8 | 44.0 | 10.7 | 24.1 | 16.6 | 46.2 | 662.2 |
| 2007 | 79.2 | 34.2 | 45.0 | 40.7 | 4.3 | 80.3 | 46.6 | 11.1 | 22.6 | 17.4 | 49.0 | 721.7 |
| 2008 | 82.7 | 35.7 | 47.0 | 41.6 | 5.4 | 85.0 | 50.6 | 11.4 | 23.0 | 50.7 | 772.8 | |
| 2009 | 34.7 | 47.4 | 41.1 | 6.3 | 787.0 | |||||||
| 2010 | 36.0 | 48.0 | 41.5 | 6.5 | 876.1 | |||||||
| 2011 | 49.4 | 42.4 | 7.0 |
¹ Values for Germany before 1994 are not fully comparable.
² Values for Britain before 1998 are not fully comparable.
Railfreight in billion metric ton kilometers
I've added some current railfreight figures for Germany. The 2009 crisis hasn't been completely compensated for, in 2011.
| Germany | DB | Others | France | SNCF | Others | GB | |||||
|---|---|---|---|---|---|---|---|---|---|---|---|
| 1994 | 70.6 | 49.7 | 13.0 | ||||||||
| 1995 | 69.7 | 49.0 | 13.3 | ||||||||
| 1996 | 68.1 | 50.5 | 15.1 | ||||||||
| 1997 | 73.2 | 52.6 | 16.9 | ||||||||
| 1998 | 74.1 | 52.7 | 17.3 | ||||||||
| 1999 | 76.8 | 52.1 | 18.2 | ||||||||
| 2000 | 82.7 | 55.4 | 18.1 | ||||||||
| 2001 | 81.0 | 50.4 | 19.4 | ||||||||
| 2002 | 81.1 | 77.2 | (-2.1%) | 3.9 | (+73.6%) | 50.0 | 18.5 | ||||
| 2003 | 85.1 | 79.2 | (+2.6%) | 5.9 | (+52.6%) | 46.8 | 18.9 | ||||
| 2004 | 91.9 | 83.1 | (+4.9%) | 8.8 | (+49.2%) | 45.1 | 20.4 | ||||
| 2005 | 95.4 | 81.7 | (-1.7%) | 13.7 | (+55.9%) | 40.7 | 21.7 | ||||
| 2006 | 107.0 | 89.5 | (+9.5%)¹ | 17.5 | (+27.9%) | 40.9 | 40.7 | 0.2 | 21.9 | ||
| 2007 | 114.6 | 92.1 | (+2.9%) | 22.5 | (+28.7%) | 42.6 | 40.6 | (-0.0%) | 2.0 | (+900%) | 21.2 |
| 2008 | 115.7 | 91.2 | (-1.0%) | 24.5 | (+8.6%) | 40.6 | 35.9 | (-11.6%) | 4.7 | (+135%) | 20.6 |
| 2009 | 95.9 | 72.3 | (-20.8%) | 23.6 | (-3.7%) | 32.7 | 26.5 | (-26.2%) | 6.2 | (+31.9%) | 19 |
| 2010 | 107.3 | 80.4 | (+11.2%) | 26.9 | (+14.0%) | 19 | |||||
| 2011 | 113.2 | 83.8 | (+4.2%) | 29.4 | (+9.3%) | 21 |
¹ incl. buying the Ruhrkohle-AG-Railroad
Amazing news about high-speed trains in China
The Washington Post makes an attempt to explain difficulties of high-speed rail to its readers. The text contains puzzling allegations about high-speed rail in China:
Sleek as they may be, China's new fast trains are too expensive for ordinary workers to ride, so they are not achieving their ostensible goal of moving passengers from the roads to the rails.
After reading this amazing statement, I looked up the results for the first high-speed line in China, Beijing-Tianjin, which went into operation in 2008, and allows to look at some preliminary results at least. Before inauguration, Beijing-Tianjin has had 8.3 million train rides per year. In the first year of high-speed operation, 15.8 million took the high-speed trains, and 2.9 million used conventional rail. From there, the line saw a steady increase of passengers, which now has passed 25 million per year. It will reach its break-even point at about 30 million riders.
For comparison, Amtrak's Acela Express attracts 3.2 million riders all along the way from Boston to Washington. Admittedly, this overweight underperformer is no match for a well-designed railroad system, but beating it 8:1 after two years is a noteworthy statement nonetheless.
If the Chinese can't afford to use these trains, this raises two questions:
- Who are those roughly 70000 riders per day, it it's not the Chinese?
- If the Chinese can't afford those trains, shouldn't this raise the number of bus riders?
To answer the second question: The number of bus rides between Beijing and Tianjin doesn't rise, but has fallen considerably, more than 30%. I'll leave the explanation, who those 70000 daily riders are, to the investigative journalists of the Washington Post.
My guess? I say they'll find out, that fact checking was not part of the publishing process for their article.
Railfreight in billion metric ton kilometers
Statistics for the first half of 2010 are out in Germany. In comparison to 2009, railfreight is up 13.8%, but the world crisis losses aren't fully compensated for. There is additional recovery since the end of June, though.
| Germany | DB | Others | France | SNCF | Others | GB | |||||
|---|---|---|---|---|---|---|---|---|---|---|---|
| 1994 | 70.6 | 49.7 | 13.0 | ||||||||
| 1995 | 69.7 | 49.0 | 13.3 | ||||||||
| 1996 | 68.1 | 50.5 | 15.1 | ||||||||
| 1997 | 73.2 | 52.6 | 16.9 | ||||||||
| 1998 | 74.1 | 52.7 | 17.3 | ||||||||
| 1999 | 76.8 | 52.1 | 18.2 | ||||||||
| 2000 | 82.7 | 55.4 | 18.1 | ||||||||
| 2001 | 81.0 | 50.4 | 19.4 | ||||||||
| 2002 | 81.1 | 77.2 | (-2.1%) | 3.9 | (+73.6%) | 50.0 | 18.5 | ||||
| 2003 | 85.1 | 79.2 | (+2.6%) | 5.9 | (+52.6%) | 46.8 | 18.9 | ||||
| 2004 | 91.9 | 83.1 | (+4.9%) | 8.8 | (+49.2%) | 45.1 | 20.4 | ||||
| 2005 | 95.4 | 81.7 | (-1.7%) | 13.7 | (+55.9%) | 40.7 | 21.7 | ||||
| 2006 | 107.0 | 89.5 | (+9.5%)¹ | 17.5 | (+27.9%) | 40.9 | 40.7 | 0.2 | 21.9 | ||
| 2007 | 114.6 | 92.1 | (+2.9%) | 22.5 | (+28.7%) | 42.6 | 40.6 | (-0.0%) | 2.0 | (+900%) | 21.2 |
| 2008 | 115.7 | 91.2 | (-1.0%) | 24.5 | (+8.6%) | 40.6 | 35.9 | (-11.6%) | 4.7 | (+135%) | 20.6 |
| 2009 | 95.9 | 72.3 | (-20.8%) | 23.6 | (-3.7%) | 32.7 | 26.5 | (-26.2%) | 6.2 | (+31.9%) | |
| 1. half 2010 | 52.5 |
¹ incl. buying the Ruhrkohle-AG-Railroad
Railfreight in billion metric ton kilometers
While the statistics for 2009 show very bad figures due to the crisis, railfreight in Germany has already recovered almost half of these losses.
| Germany | DB | Others | France | SNCF | Others | GB | |||||
|---|---|---|---|---|---|---|---|---|---|---|---|
| 1994 | 70.6 | 49.7 | 13.0 | ||||||||
| 1995 | 69.7 | 49.0 | 13.3 | ||||||||
| 1996 | 68.1 | 50.5 | 15.1 | ||||||||
| 1997 | 73.2 | 52.6 | 16.9 | ||||||||
| 1998 | 74.1 | 52.7 | 17.3 | ||||||||
| 1999 | 76.8 | 52.1 | 18.2 | ||||||||
| 2000 | 82.7 | 55.4 | 18.1 | ||||||||
| 2001 | 81.0 | 50.4 | 19.4 | ||||||||
| 2002 | 81.1 | 77.2 | (-2.1%) | 3.9 | (+73.6%) | 50.0 | 18.5 | ||||
| 2003 | 85.1 | 79.2 | (+2.6%) | 5.9 | (+52.6%) | 46.8 | 18.9 | ||||
| 2004 | 91.9 | 83.1 | (+4.9%) | 8.8 | (+49.2%) | 45.1 | 20.4 | ||||
| 2005 | 95.4 | 81.7 | (-1.7%) | 13.7 | (+55.9%) | 40.7 | 21.7 | ||||
| 2006 | 107.0 | 89.5 | (+9.5%)¹ | 17.5 | (+27.9%) | 40.9 | 40.7 | 0.2 | 21.9 | ||
| 2007 | 114.6 | 92.1 | (+2.9%) | 22.5 | (+28.7%) | 42.6 | 40.6 | (-0.0%) | 2.0 | (+900%) | 21.2 |
| 2008 | 115.7 | 91.2 | (-1.0%) | 24.5 | (+8.6%) | 40.6 | 35.9 | (-11.6%) | 4.7 | (+135%) | 20.6 |
| 2009 | 95.9 | 72.3 | (-20.8%) | 23.6 | (-3.7%) | 32.7 | 26.5 | (-26.2%) | 6.2 | (+31.9%) |
¹ incl. buying the Ruhrkohle-AG-Railroad
Acceleration of DMUs: Regioshuttle Data
Quite some time ago, I was asked about the minimum useful station distance for rail transit without electrification.
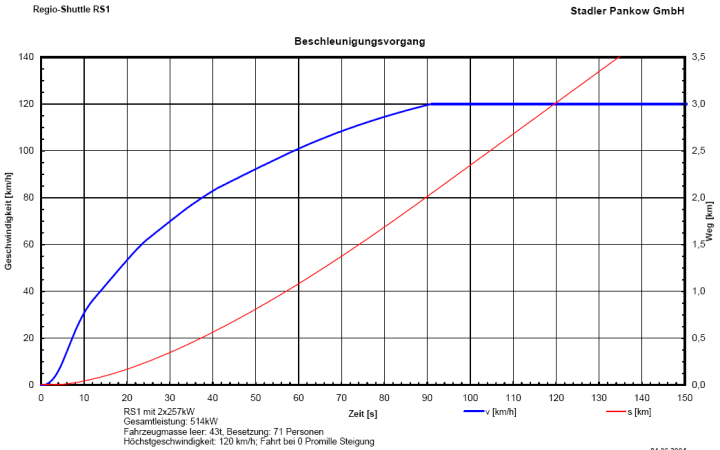
For giving a precise answer, I obtained data from Stadler, for their „Regioshuttle“ DMU. This acceleration graph has now lived in my website's tmp directory for years. Some of you were linked to it directly.
Starting this Blog gives good opportunity for publishing such little pieces of information for everybody. „Geschwindigkeit“ ≘ „Speed“, „Zeit“ ≘ „Time“, „Weg“ ≘ „Distance“.
Another „thank you“ to the helpful engineers at Stadler.