Speed-Zone 11:
The Siskiyou Pass

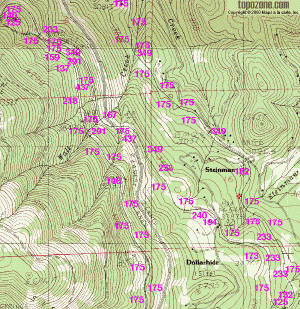
Milepost 406.3 to Steinman

This is the slowest speed zone of the Siskiyou Line. Standard curve radius is 574 feet, the grade steepens from 3.3% to 3.67%, and both sides have loop curves with a radius of 410 feet. The slowest sections of an operation have a disproportionate effect on total average speed. Squeezing a few additional mph out of slow sections like this has a much higher effect than upgrading the Northern California Valley to 140 mph, at lower cost for the minute saved.

Train enters tunnel, in the middle of snow and high trees.
The Siskiyou summit with the northern portal of Tunnel 13, located 4122 feet above sea level.

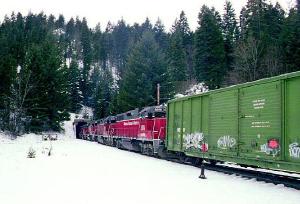
Within this high mountain section, it won't be possible to use the full 6 inches of superelevation. Transitions from curve to curve are too short at several places, and even with additional power, the freight trains will be too slow, and damage the inner rail of fully superelevated track. 4 inches will probably be at the limit of possibilities. Additional obstacles will be tunnel 14, which has very tight clearances and might not allow any superelevation, and Wall Creek Viaduct. While the curve built into this viaduct is less sharp than many others, using high values of unbalanced superelevation might be impossible at the transition to the viaduct. When the Siskiyou Line was built, it has had lots of high trestles - wooden trestles. With the exception of the steel trestle above Wall Creek, all of them have been filled up, and are railroad dams today.

Steam passenger train on huge wooden trestle, doubleheaded and with pusher.
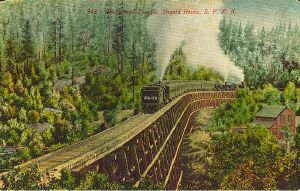
Passenger train on Dollarhide Trestle, about 100 years ago.

All the difficulties taken into account: If the suggested strategy, as outlined on page 36, is fully implemented, the situation isn't as bad as probably expected. Thanks to using all the unbalanced superelevation gained by tilting, average speed would be a little higher than in the Sacramento River Canyon, which is part of the current Amtrak route, and considerably faster than the "Coast Starlight" operates in that section today.

Topo map shows the looping track.
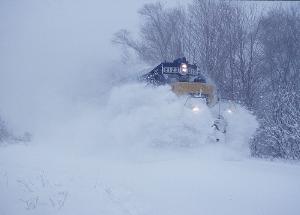
The trains will need acceleration ability on 3.4%, after passing a loop curve.

A detailed look at the Siskiyou Pass should explain, why requirements like "14 - 15 hp/ton of traction power" have been postulated on page 19, for the trains to use on the Shasta Route. After passing the tight loops, the trains have to accelerate back to the possible line speed of 43 mph, while on a 3.4% grade (northern side) or a 3.67% grade (southern side). If a traffic concept is based on standard Amtrak equipment, using the Siskiyou Line for passenger traffic isn't worth a second of consideration.

Achievable timing
Location Distance ...added up  Time elapsed Coast Starlight Average speed ...added up
Steinman 13 mi (21 km) 314 mi (505 km) 00:20 05:20 - 37 mph (60 km/h) 59 mph (95 km/h)
MP 406.3 21 mi (34 km) 301 mi (485 km) 00:28 05:00 - 45 mph (73 km/h) 60 mph (97 km/h)
Willow Bridge 32 mi (52 km) 280 mi (451 km) 00:29 04:32 - 67 mph (108 km/h) 62 mph (99 km/h)
Edgewood 5 mi (8 km) 248 mi (399 km) 00:07 04:03 - 43 mph (69 km/h) 61 mph (98 km/h)
Weed 0 243 mi (392 km) 00:01 03:56 - - 62 mph (99 km/h)
Weed 4 mi (7 km) 243 mi (392 km) 00:06 03:55 - 42 mph (68 km/h) 62 mph (100 km/h)
Black Butte 12 mi (19 km) 239 mi (385 km) 00:14 03:49 - 52 mph (84 km/h) 63 mph (101 km/h)
Azalea 11 mi (18 km) 227 mi (365 km) 00:21 03:35 - 32 mph (52 km/h) 63 mph (102 km/h)
Dunsmuir 0 216 mi (348 km) 00:01 03:14 05:05 - 67 mph (108 km/h)
Dunsmuir 26 mi (42 km) 216 mi (348 km) 00:44 03:13 ??:?? 36 mph (58 km/h) 67 mph (108 km/h)
MP 296 30 mi (48 km) 189 mi (304 km) 00:36 02:30 - 51 mph (82 km/h) 76 mph (122 km/h)
Redding 0 159 mi (256 km) 00:02 01:54 03:15 - 84 mph (135 km/h)
Redding 25 mi (40 km) 159 mi (256 km) 00:17 01:52 ??:?? 89 mph (143 km/h) 85 mph (137 km/h)
MP 233 10 mi (16 km) 134 mi (216 km) 00:09 01:35 - 68 mph (109 km/h) 84 mph (135 km/h)
Red Bluff 0 124 mi (200 km) 00:01 01:27 - - 86 mph (138 km/h)
Red Bluff 39 mi (63 km) 124 mi (200 km) 00:26 01:26 - 91 mph (146 km/h) 87 mph (140 km/h)
Chico 0 85 mi (136 km) 00:01 01:00 01:56 - 85 mph (137 km/h)
Chico 44 mi (71 km) 85 mi (136 km) 00:29 00:59 ??:?? 91 mph (146 km/h) 87 mph (140 km/h)
Marysville WP 0 41 mi (66 km) 00:02 00:30 - - 86 mph (138 km/h)
Marysville WP 41 mi (66 km) 41 mi (66 km) 00:28 00:28 - 90 mph (145 km/h) 90 mph (145 km/h)
Sacramento 0 mi (0 km) 0 mi (0 km) 00:00 00:00 00:00 0 mph (0 km/h) 0 mph (0 km/h)

For this part of the route, the author does not have any suggestion for realignment. Especially the loops on the northern side are close to unreplaceable, short of a base tunnel for the whole speed zone. Due to the loops, road traffic on the Interstate 5 will always be faster than rail between Hornbrook and Ashland. At least, this is true under good weather conditions. Price for the faster alignment of Interstate 5 has been a grade of 6%, which means serious problems with truck traffic in winter. In bad years, the Siskiyou collects up to 10 feet of snow, and the historical high mark was set in January 1890, when the railroad line collected 13 - 50 feet of snow, with boxcar roofs crushed in by the snow load.

But in a normal winter, the Siskiyou line is clearable by a properly designed trains's snowplow, without any special equipment to send out.

Loco pushes its way through the snow.
Bad weather reliability can be an advantage of rail over road.

Experience in Japan, Switzerland, Norway shows, that all-weather reliability can be a major advantage of rail, because a positive image of the railroads attracts passengers, long term. The same would be possible on the Shasta Route: Reliably running to the summer timetable under almost any condition encountered. Regarding snowclearing, US railroads have all the advantages but one: Money. While the Interstate 5 is cleared using federal funds, clearing the Siskiyou Line is the private hobby of Central Oregon & Pacific.


Unit conversion for text on this page.
574 feet radius 175 m radius 10 degrees of curvature
410 feet radius 125 m radius 14 degrees of curvature
140 mph 225 km/h  
4122 feet 1256 m  
6 inches 152 mm  
4 inches 102 mm  
14 - 15 hp/ton 11.5 - 12.3 kW/metric ton  
43 mph 69 km/h  
10 feet 3.05 m  
13 - 50 feet 3.96 - 15.24 m  

about this document            Hans-Joachim Zierke            © notice            Thank you


Last modified: 2003-10-07